

From the OLAP Manager, you can connect to a SQL Server (Express edition supported too), Azure SQL (cloud) or to Access database (*.mdb, *.accdb) and then select a particular table, typically, a fact or transaction table, to show up all the available fields defined for that table (and their related source tables via the foreign key).
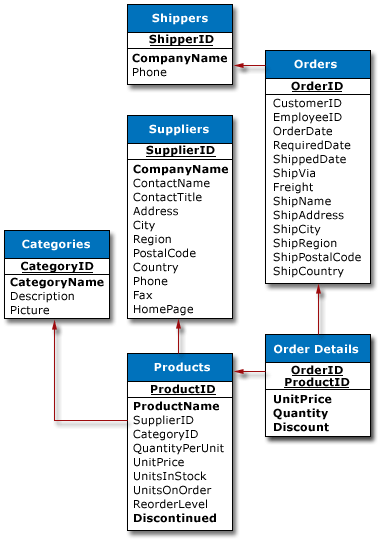
For this example, we are connecting to the ‘Order Details‘ transaction table of the Northwind Traders sample database, the schema of which is given on the right:
In the OLAP Manager (below), notice that all other fields from related tables (linked through foreign keys) such as Orders, Products, Categories etc. are automatically pulled out, for inclusion into the cube.
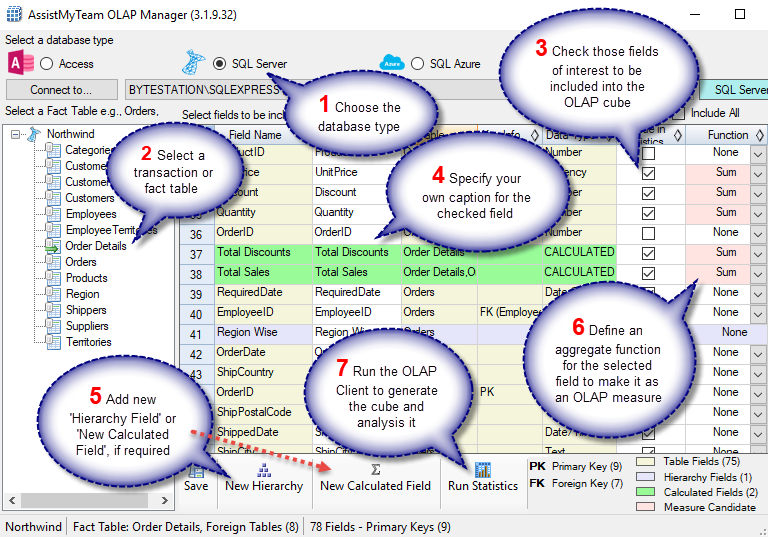
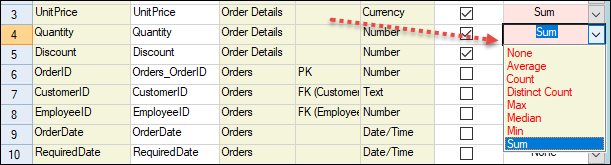
Once you have chosen which fields or dimensions to include in the statistic, you can select functions for those numeric/currency fields to act as ‘measures’ in the OLAP cube, such that, statistics can be generated across other fields, based on the value of the ‘measure’ fields.
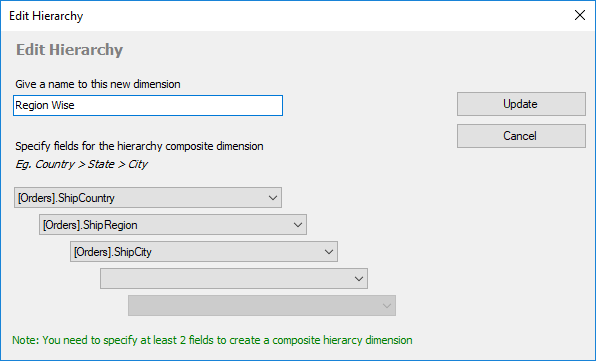
You can add a new hierarchy dimension that supports up to five (5) levels of parent-child members. For example, we have defined a new hierarchy ‘Region Wise’ having the members Ship Country > Ship Region > Ship City, all from belonging to the Orders table.
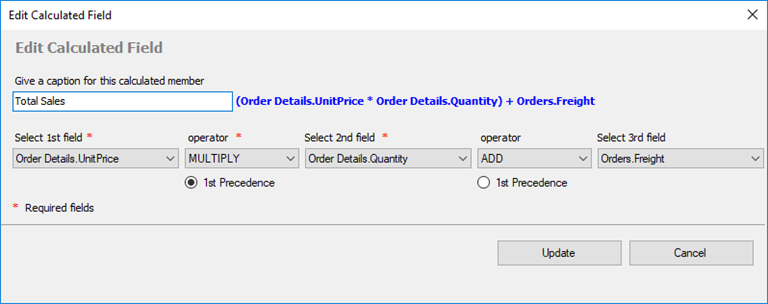
You can also create a new calculated (composite) field derived from mathematical functions between 2 or more member fields. For example, below, we have added a new calculated member ‘Total Sales’ that performs a computational operation involving (Unit Price * Quantity) + Freight.
Once you have chosen which fields or dimensions to include in the statistic, you can select aggregate functions such as count, distinct count, sum, average, maximum or minimum for those numeric or currency fields, so as to set them as ‘measures’ in the OLAP cube.
Selected fields and defined functions are saved for that specific table (in the favorites) so that when you come connect back to this database table the next time, it will show the same selected fields, and other composite/calculated fields, if you have added any.
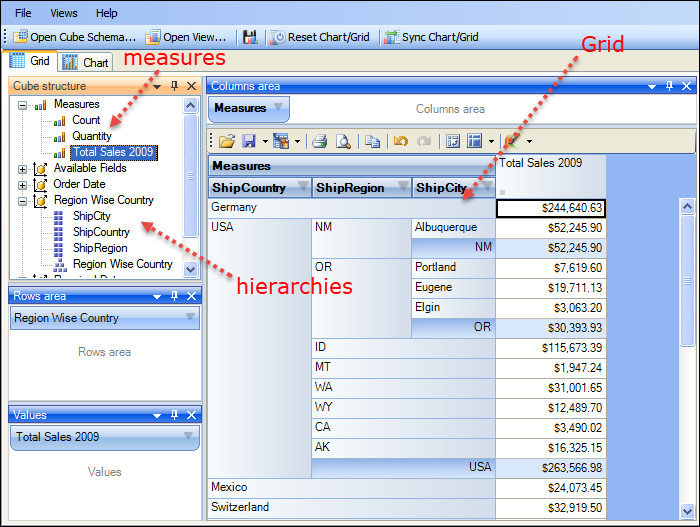
Finally, from the OLAP Manager tool, a cube schema file is then created and feed to the OLAP Client tool (below) to process and extract the cube from the database. This OLAP Client tool, consists of the Grid and Chart Views. On the left is the Cube structure – measures and hierarchies as a tree. The measures are grouped in the set, displayed in the branch. All the rest of the tree nodes are the dimensions that contain hierarchies. You can then drag dimensions (fields) from the cube structure to the pivot areas (Columns and Rows areas), and then select a measure or two from the cube and drag it to the values area to generate the statistics.
Screenshot: OLAP Grid View – Country/Region/City wise sales data for 2009:
OLAP Grid
The OLAP Client Grid view (above) is comprised of a multi-dimensional table with expandable nodes. These nodes group and display data according to the hierarchies used to define the measures and dimensions upon which the underlying data has been organized. In tandem with the OLAP Chart view, the OLAP Grid view provides an ideal means of clearly conveying data to the user. It is highly navigable and quickly provides detailed information to the user. The speed with which data recall occurs and the strong formatting the grid enforces ensure data is always presentable and easily understandable. Consequently, OLAP Grid views can easily be ported to spreadsheet applications for report compilation purposes.
You can navigate through these dimensions by drilling down, rolling up, or drilling across. You can drill down to access the detailed level of data or roll up to see the summarized data. You can roll up through the hierarchy levels of dimensions or to specific characteristics or data elements (columns) of the dimensions. You can also drill across dimensions to access the data of interrelated dimensions. In addition, you can set one of these powerful computational functions such as sum, averages, distinct count, maximum, minimum etc. for the measure field.
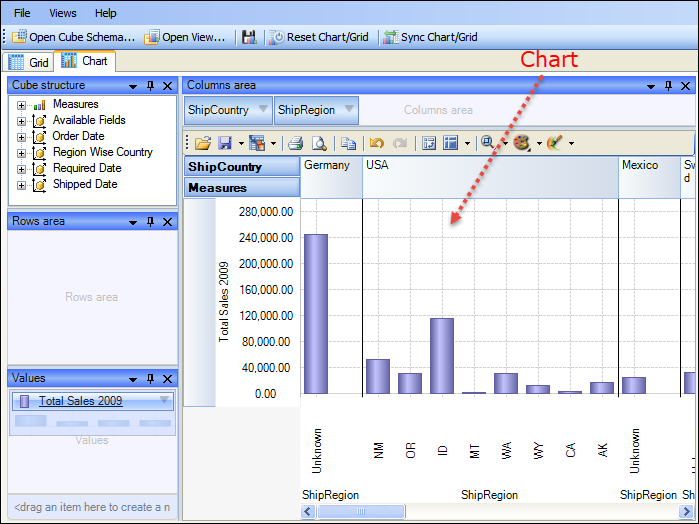
OLAP Chart
While the Grid view (below) allows working with numbers, chart view allows representing your data graphically. This gives you and your team a unique opportunity to analyze data visually, dealing with charts rather than numbers, which is much easier to perceive. Now it’s easier than ever to spot new trends and discover unknown problems in your data flow. The statistical tool will help you gain an insight into your data and make new discoveries.
Screenshot: OLAP Chart view – Country/Region/City wise sales data for 2009:
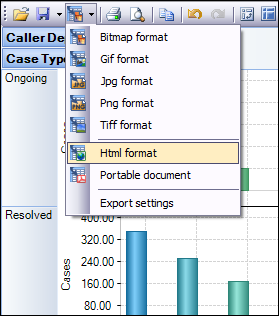
Exporting to File
After a particular snapshot of the statistics is achieved, if you need to share or publish the statistical findings, export it to images, PDF, Excel etc., or print it.
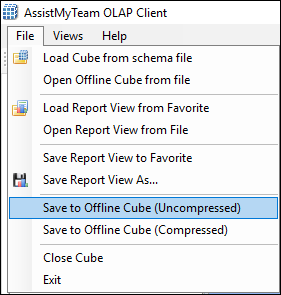
You also have the options to save the pivot settings to file, for accessing the same snapshot in future. If your database is located on a network, you can also save the cube data to file such that you can work offline with the cube, even when the database is not available, or when the network is disconnected.
To put in perspective, AssistMyTeam OLAP Tool can
Put information into the hands of the decision makers – Interact with your data and investigate relationships within the data with simple navigation tools. AssistMyTeam OLAP also provides context, relevance and visualization of the data
Ask questions of the database – Run query and get the result within seconds. AssistMyTeam OLAP usually provides for very fast query performance. The usual OLAP query is returned in within 4 seconds.
Run complex calculations on the OLAP cube to provide aggregated data
Easily create your own analytic views. AssistMyTeam OLAP makes it very easy to create new “views” of the data. There are no complex joins to create.
Combine your data in any order, at any level of summarization, and over several time periods.
Enable you to perform Market Basket Analysis. E.g. How many customers who bought product A also bought product B?