OLAP for SharePoint List

Extract Business Intelligence from Microsoft SharePoint Lists

OLAP tool to analyze SharePoint lists data in multi-dimensional view in grids, charts and graphs. Helps you to gain insight and make new discoveries, extract intelligence for better decision-making.

Available for a fully functional 30 days trial.

Product Summary

  • Works with WSS, MOSS, SharePoint and Office 365
  • Support almost all data types used in SharePoint list
  • Choose your own fields and set them as measures or dimensions for OLAP representation
  • Supports the following functions for Measures – Count, Distinct Count, Max, Min, Average, Sum etc.
  • Supports common OLAP operations including slice and dice, drill down, roll up, and pivoting on the cube.
  • Supports date/time fields to be summarized or broken down to year, month, day, week, hours, minutes etc.
  • Create your own composite hierarchyE.g., Country > State > City
  • Create your own calculated member with computational relationship. E.g., Total Sales = (UnitPrice X Quantity) + Freight
  • OLAP Grid and Chart with highly interactive, customizable and user-friendly interface.
  • Save the pivot details to file (*.olapreport) to make it easy for later use without starting from scratch.
  • Support offline cube (to *.offlinecube) for use in disconnected mode.
  • Complete control over the export settings of the grid/chart reports.
  • Export grid/chart reports as BMP, GIF, JPEG, PNG, TIFF, TXT, CSV, PDF, HTML, XML, XLS
  • Share pivot details, reports, offline cube, cube schema files among team members to facilitate collaboration.
  • Print Preview tool.
THE PROBLEM

Lack of analysis feature in SharePoint

SharePoint has become a de-facto platform for storing and sharing business data in lists, document libraries etc. among team members in organizations. But unlike the ease of reporting and running statistics on relational database, SharePoint on its own does not provide such flexibility when it comes to extracting business intelligence.

Due to this limitation, often, managers might find themselves spending a lot of time and resource in exporting data to spreadsheet and performing manual computation and parsing. Some organizations even use specialized data professionals and a dozen different software packages, just to produce simple reports. Worst, if the report doesn’t have the required information, you will have to start over, wasting precious time.

THE SOLUTION

OLAP tool for Microsoft SharePoint lists

As there is a time and expense involved in getting answers from SharePoint lists, a lot of business intelligence information often goes unused, due to that fact that, SharePoint is designed to store data, and not to help you analyze it. It is with this requirement in mind, that we have designed AssistMyTeam OLAP tool for SharePoint, to give you a simple and yet powerful tool to let you configure OLAP cube from your SharePoint lists, and then analyze and create reports straightaway, out of the box.

AssistMyTeam OLAP for SharePoint can connect to a SharePoint list, task or calendar and explore data in a multi-dimensional grid, pivot tables, filters, graph or chart view. With the capability of complex calculations, trend analysis and sophisticated data modeling, and reporting, it helps you to identify critical information on your SharePoint data.

To put in perspective, AssistMyTeam OLAP tool for SharePoint can

  • Combine your data, at any level of summarization, order and over several time periods
  • Run complex calculations on the OLAP cube to provide aggregated data
  • Get multiple views on summarized data and perform complex detailed analysis
  • Interact with your data to view relationships, context and relevance within dimensions
  • Share or publish the statistical snapshot, export it to image, PDF, Excel, or print it
  • Create new ‘report views’ of any particular snapshot of the statistics and save it for easy retrieval and future use

how it works

In the OLAP SharePoint Manager tool, you can enter the URL of your SharePoint site (e.g., http://companyweb/) such that it would show up all the available lists in a hierarchical tree from which you can select a particular SharePoint list to configure for OLAP Cube.

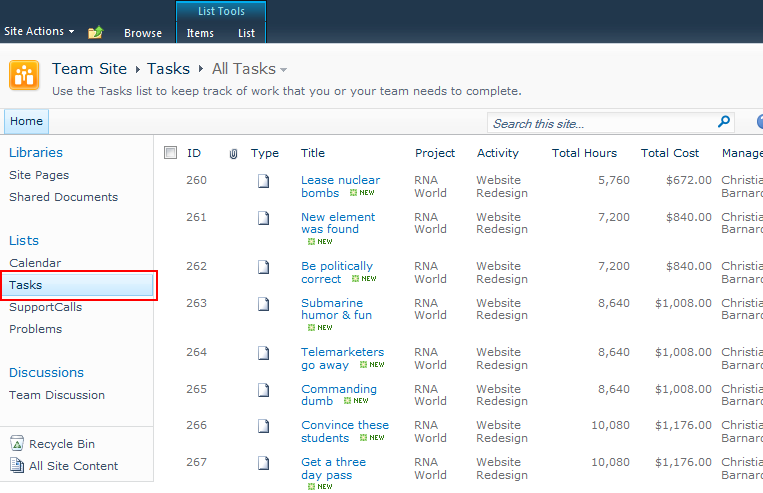
Alternatively, you can also enter the URL of the particular SharePoint list (e.g., http://companyweb/Lists/Tasks/AllItems.aspx) to directly load the available fields in the grid for cube configuration. With either technique, you can choose which SharePoint fields to include in the cube. You can also set aggregate function for the measure fields or define new derived fields such as a hierarchy or a calculated field.

OLAP SharePoint Manager allows you to prepare and configure a SharePoint list for generating an OLAP cube

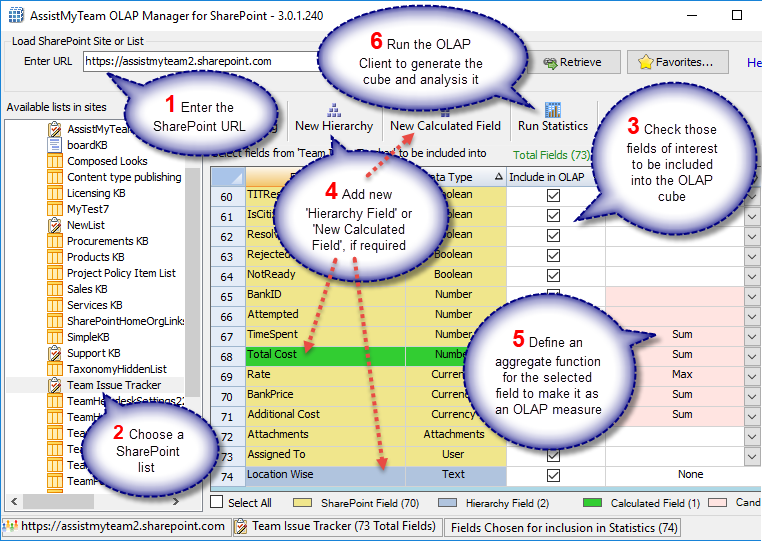
As seen in the screenshot above, apart from the SharePoint fields, you can add your own derived OLAP fields such as a composite hierarchical field (e.g.. Project-Task) or a calculated field (e.g.. Total Project Budget), based on existing SharePoint fields. For easy recognition, derived fields are distinctly colored and highlighted (in green).

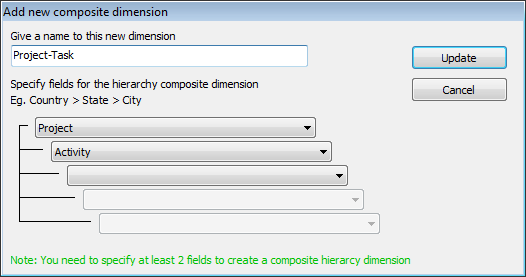
New OLAP composite dimension – E.g., Project – Task

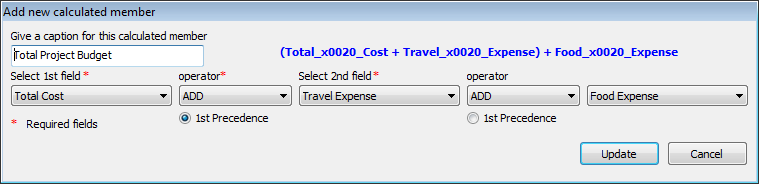
New OLAP calculated member – E.g., Total Project Budget

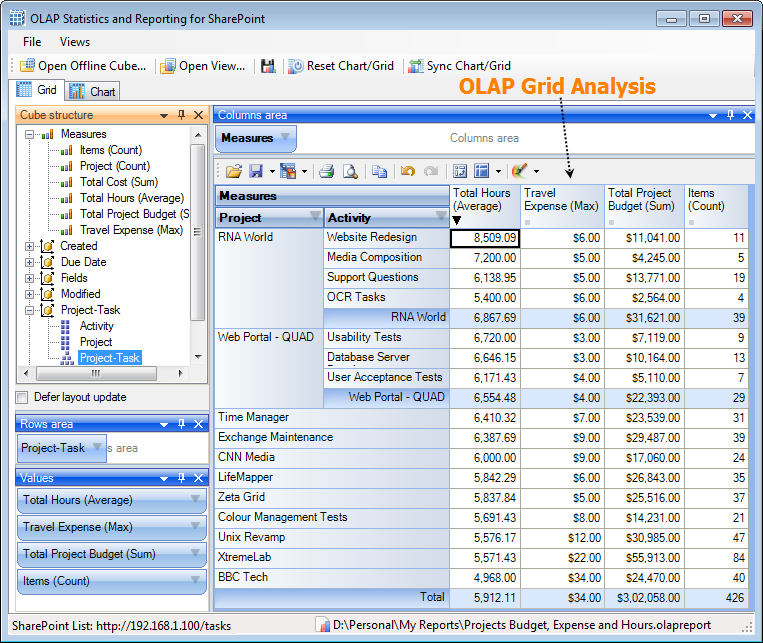
When you click the ‘Run Statistics‘ button, it would generate a cube, which will be loaded in the OLAP Statistics tool that consists of the Grid and Chart Views as shown below.

OLAP Grid allows for building reports of exceptional level of complexity, in a few steps

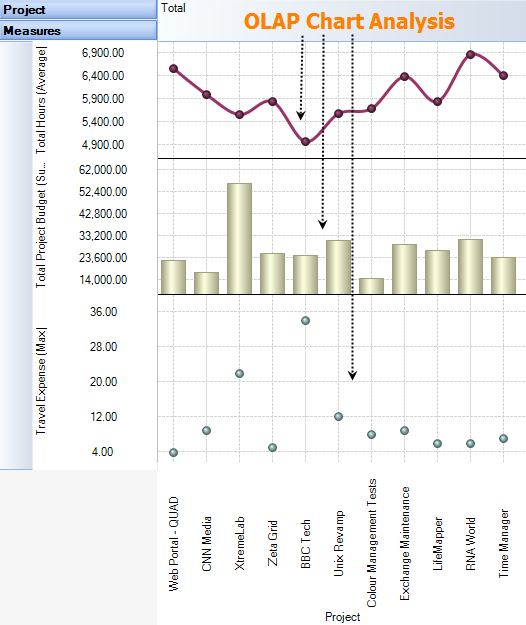
OLAP Chart allows representing the data graphically which is much easier to perceive

0
With over 1200+ customers across 50 countries including fortune 500 companies, government and non-profit agencies, freelance consultants, educational institutions and universities, etc.