
SharePoint has become a de-facto platform for storing and sharing business data in lists, document libraries etc. But unlike the ease of reporting and running statistics on relational database, SharePoint on its own does not provide such flexibility when it comes to extracting business intelligence. Due to this limitation, often, managers might find themselves spending a lot of time and resource in exporting data to spreadsheet, and performing manual computation and parsing. Some organizations even use specialized data professionals and a dozen different software packages, just to produce simple reports. Worst, if the report doesn’t have the required information, you will have to start over, wasting precious time.
As there is a time and expense involved in getting answers from SharePoint lists, a lot of business intelligence information often goes unused, due to that fact that, SharePoint is designed to store data, and not to help you analyze it.
Mining intelligence and insights from data stored in SharePoint
The AssistMyTeam OLAP tool for SharePoint, is designed to give you a simple and yet powerful tool to configure OLAP cube from your SharePoint lists, and then analyze and create reports straightaway, out of the box. It is perfectly suited to spot new trends and discover unknown problems from your data that are stored in SharePoint lists.
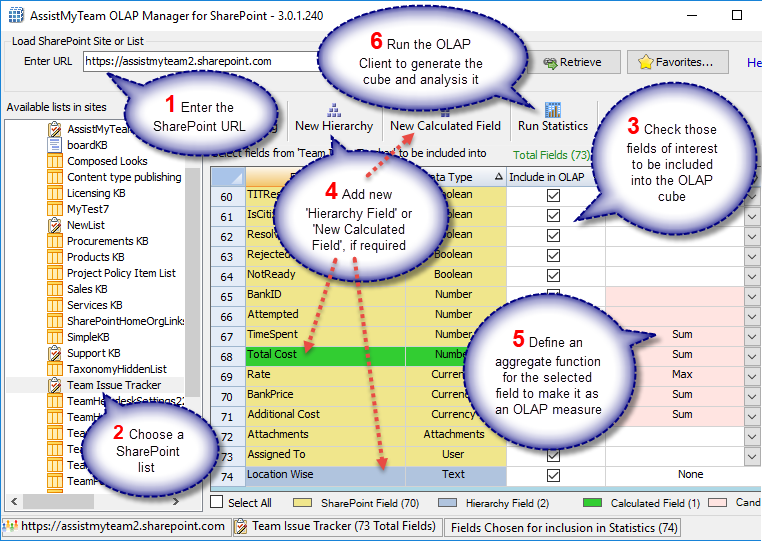
In the OLAP SharePoint Manager tool, you can enter the URL of your SharePoint site (e.g.. http://companyweb/) to show up all the available lists in a hierarchical tree from which you can select a particular SharePoint list to configure for OLAP Cube. Alternatively, you can also enter the URL of the particular SharePoint list (e.g.. http://companyweb/Lists/Tasks/AllItems.aspx) to directly load the available fields in the grid for cube configuration. With either techniques, you can choose which SharePoint fields to include in the cube. You can also set aggregate function for the measure fields or define new derived fields such as a hierarchy or a calculated field.
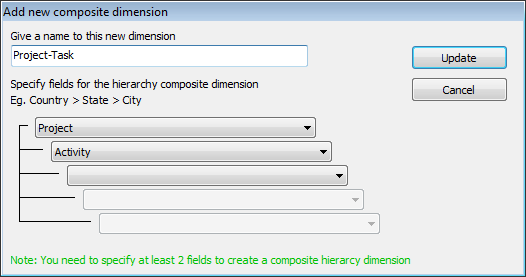
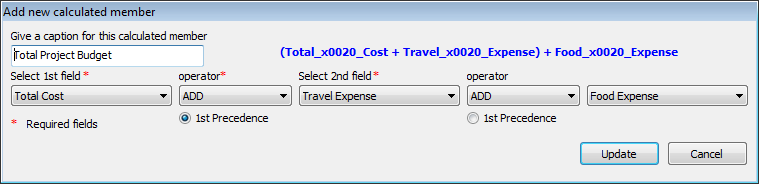
You can add your own derived OLAP fields such as a composite hierarchical field (e.g.. Project-Task) or a calculated field (e.g.. Total Project Budget), based on existing SharePoint fields. For easy recognition, derived fields are distinctly colored and highlighted (in green).
New OLAP composite dimension – E.g. Project – Task
New OLAP calculated member – E.g. Total Project Budget
Once you have chosen which fields or dimensions to include in the statistic, you can select aggregate functions such as count, distinct count, sum, average, maximum or minimum for those numeric or currency fields, so as to set them as ‘measures’ in the OLAP cube.
When you click the ‘Run Statistics‘ button, it would generate a cube, which will be loaded in the OLAP Statistics tool that consists of the Grid and Chart Views as shown below. This OLAP Client tool, consists of the Grid and Chart Views. On the left is the Cube structure – measures and hierarchies as a tree. The measures are grouped in the set, displayed in the branch. All the rest of the tree nodes are the dimensions that contain hierarchies. You can then drag dimensions (fields) from the cube structure to the pivot areas (Columns and Rows areas), and then select a measure or two from the cube, and drag it to the values area to generate the statistics.
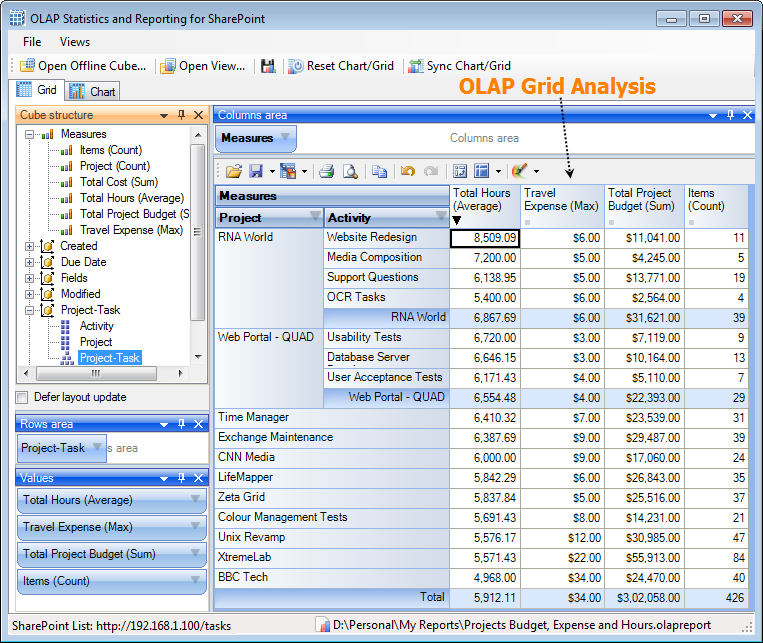
OLAP Grid
The OLAP Client Grid view (above) is comprised of a multi-dimensional table with expandable nodes. These nodes group and display data according to the hierarchies used to define the measures and dimensions upon which the underlying data has been organized. In tandem with the OLAP Chart view, the OLAP Grid view provides an ideal means of clearly conveying data to the user. It is highly navigable and quickly provides detailed information to the user. The speed with which data recall occurs and the strong formatting the grid enforces ensure data is always presentable and easily understandable. Consequently, OLAP Grid views can easily be ported to spreadsheet applications for report compilation purposes.
You can navigate through these dimensions by drilling down, rolling up, or drilling across. You can drill down to access the detailed level of data, or roll up to see the summarized data. You can roll up through the hierarchy levels of dimensions or to specific characteristics or data elements (columns) of the dimensions. You can also drill across dimensions to access the data of interrelated dimensions. In addition, you can set one of these powerful computational functions such as sum, averages, distinct count, maximum, minimum etc. for the measure field.
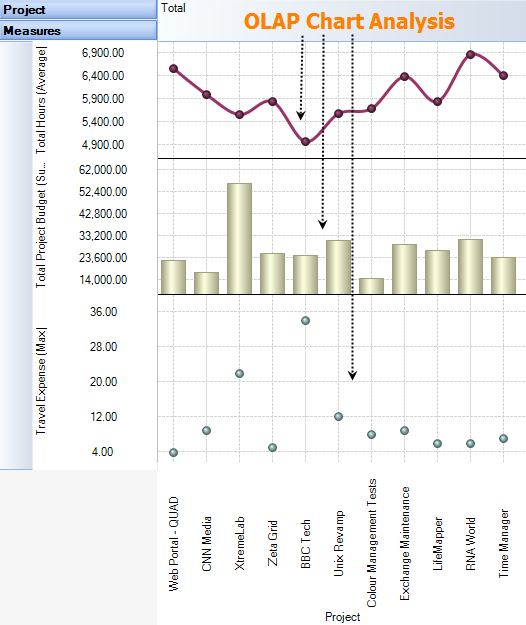
OLAP Chart
While the Grid view (below) allows working with numbers, chart view allows representing your data graphically. This gives you and your team a unique opportunity to analyze data visually, dealing with charts rather than numbers, which is much easier to perceive. Now it’s easier than ever to spot new trends and discover unknown problems in your data flow. The statistical tool will help you gain an insight into your data and make new discoveries.
Exporting to file
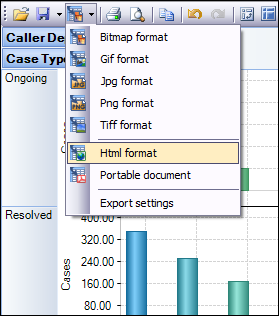
After a particular snapshot of the statistics is achieved, If you need to share or publish the statistical findings, export it to image, PDF, Excel etc, or print it.
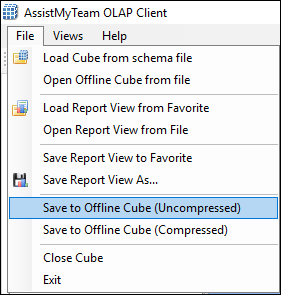
You also have the options to save the pivot settings to file, for accessing the same snapshot in future. If your database is located on a network, you can also save the cube data to file such that you can work offline with the cube, even when the database is not available, or when the network is disconnected.
Benefits
AssistMyTeam OLAP tool for SharePoint provides managers with the unique ability to explore large complex data from your SharePoint and allows displaying in grids, charts and graphs and support most common operations such as pivoting, drill down/slice and dice, filtering etc. With such arrays of information, you and your management team can re-engineer your business processes, reinforce resources and forecast problem areas and exploit all these factors for competitive advantage. With the capability of complex calculations, trend analysis and sophisticated data modeling, and reporting, OLAP tool helps you to identify critical information on your not so obvious data and extract mission critical information and intelligence that will enable better decision – in your business.
For more information on this OLAP tool for SharePoint, go to the product page at – https://www.assistmyteam.com/olap-sharePoint/
If you have any questions, please leave a comment below.