
Managers often find it difficult to get the correct insights from their emails, appointments or tasks that are tagged with projects or some business data. Though Outlook views are excellent way of presenting information in a more obvious way in folder, it does not give you the summarized data that one needs often, to see broader trends based on aggregation, and to see these trends broken down by any number of variables. Given that the generalization of information using Outlook views are constrained by a few fields (or dimensions) at a time, it is hard to fully evaluate a complex set of answers without the ability to inspect each dimension in detail, while at the same time, preserving context eliminating all guesswork.
Mining intelligence and insights from Outlook emails, appointments or tasks
The AssistMyTeam OLAP tool for Outlook is designed to give you a simple and yet powerful tool to configure OLAP cube from your mailbox, and then analyze and create reports straightaway, out of the box. It is perfectly suited to spot new trends and discover unknown problems from your Inbox, Calendar or Task folders. The tool allows you to define any field as the measure with different function – sum, count, distinct count, maximum, minimum etc, against which statistics is to be executed. Real strength of this tool is its ability to examine and view data in ways not ordinarily possible. By allowing varying levels of granularity during data inspection and visualization, a lot of information can be revealed that would otherwise be hard to attain. Now it is easier than ever to spot new trends and easily answer many of the perspective information which otherwise are hidden.
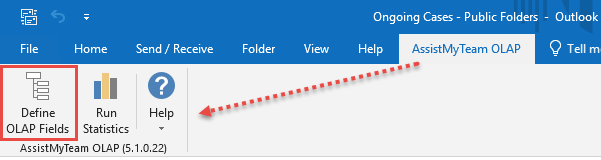
On every outlook folder, you will find the OLAP toolbar, containing two buttons – first one enables you to choose which fields or dimensions (including user defined ones) to include in the statistic. It also lets you define which fields will act as ‘measures‘ in the function column. Selected fields and other settings are saved for that specific folder so that when you come back to this folder next time, it will show the same selected fields.
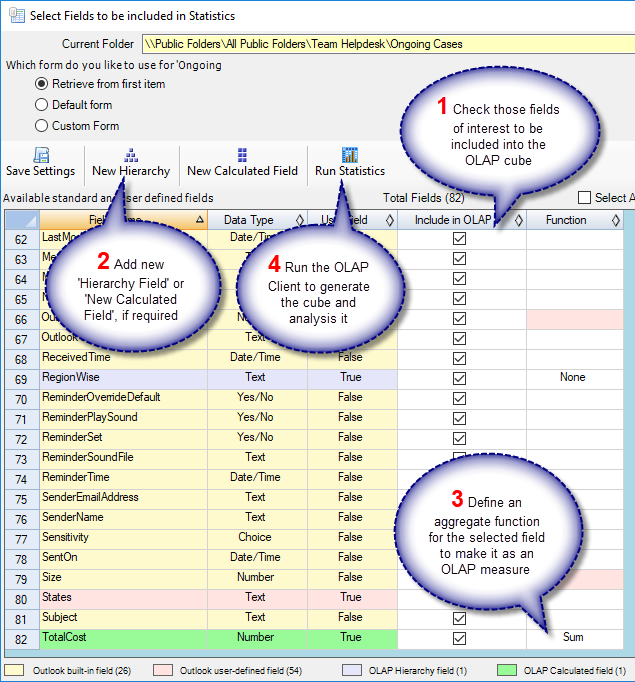
As seen in the screenshot above, user-defined fields are distinctly highlighted for easy recognition. For example, States, TotalCost, RegionWise are user-defined fields in this task folder. You can also add new OLAP fields – a composite (also known as hierarchy) or a calculated field, based on the existing member fields of Outlook. OLAP fields are also colored differently for easy recognition (e.g., green)
New OLAP composite dimension – E.g., Projects per Country

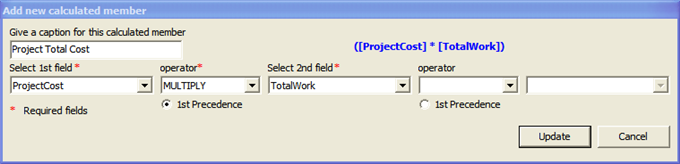
New OLAP calculated member – E.g., Projects Total Cost
Then you can run the statistics tool from the toolbar or from the fields selection dialog. Depending on the number of folder items, it might take a few seconds to generate the cube from the Outlook folder, before loading the OLAP Statistics tool, as shown below.
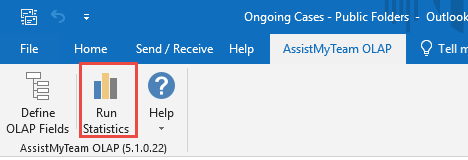
When you click the ‘Run Statistics‘ button, it would generate a cube from the particular Outlook folder (e.g., Inbox or Calendar), which will be loaded in the OLAP Statistics tool. This tool consists of the Grid and Chart Views. On the left is the Cube structure – measures and hierarchies as a tree. The measures are grouped in the set, displayed in the branch. All the rest of the tree nodes are the dimensions that contain hierarchies. You can then drag dimensions (fields) from the cube structure to the pivot areas (Columns and Rows areas), and then select a measure or two from the cube, and drag it to the values area to generate the statistics.
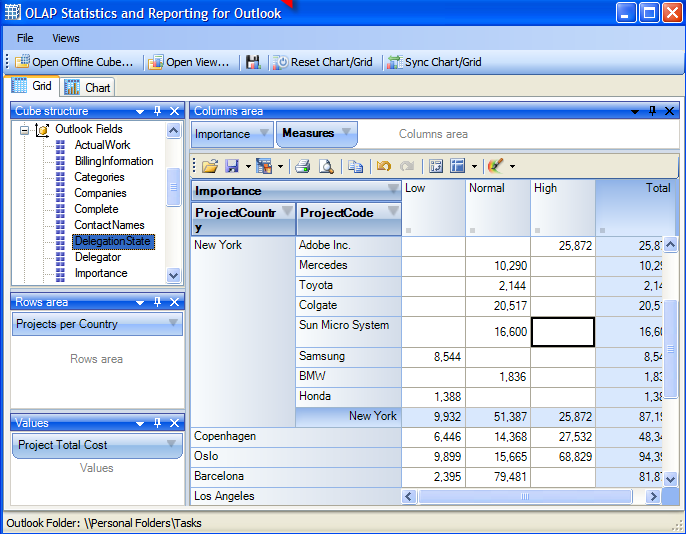
OLAP Grid view
The OLAP Client Grid view (above) is comprised of a multi-dimensional table with expandable nodes. These nodes group and display data according to the hierarchies used to define the measures and dimensions upon which the underlying data has been organized. In tandem with the OLAP Chart view, the OLAP Grid view provides an ideal means of clearly conveying data to the user. It is highly navigable and quickly provides detailed information to the user. The speed with which data recall occurs and the strong formatting the grid enforces ensure data is always presentable and easily understandable. Consequently, OLAP Grid views can easily be ported to spreadsheet applications for report compilation purposes.
You can navigate through these dimensions by drilling down, rolling up, or drilling across. You can drill down to access the detailed level of data, or roll up to see the summarized data. You can roll up through the hierarchy levels of dimensions or to specific characteristics or data elements (columns) of the dimensions. You can also drill across dimensions to access the data of interrelated dimensions. In addition, you can set one of these powerful computational functions such as sum, averages, distinct count, maximum, minimum etc. for the measure field.
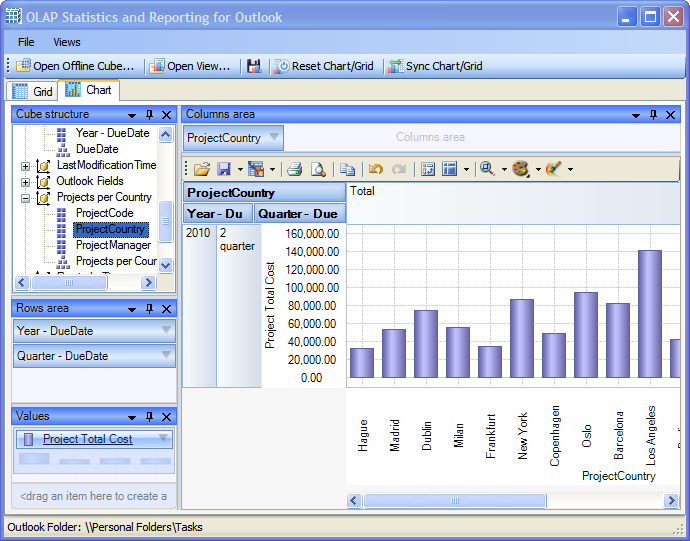
OLAP Chart view
While the Grid view (below) allows working with numbers, chart view allows representing your data graphically. This gives you and your team a unique opportunity to analyze data visually, dealing with charts rather than numbers, which is much easier to perceive. Now it’s easier than ever to spot new trends and discover unknown problems in your data flow. The statistical tool will help you gain an insight into your data and make new discoveries.
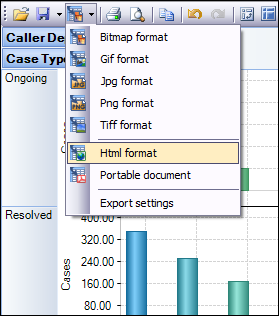
Exporting to file
After a particular snapshot of the statistics is achieved, If you need to share or publish the statistical findings, export it to image, PDF, Excel etc, or print it.
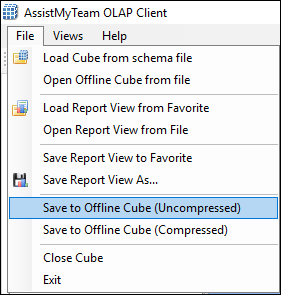
You also have the options to save the pivot settings to file, for accessing the same snapshot in future. If your database is located on a network, you can also save the cube data to file such that you can work offline with the cube, even when the database is not available, or when the network is disconnected.
Benefits
AssistMyTeam OLAP tool for Microsoft Outlook provides managers with the unique ability to explore metadata and project information stored in emails or appointments in multidimensional view in the form of grids, charts and graphs. With support most common operations such as pivoting, drill down/slice and dice, filtering etc., you and your management team can re-engineer your business processes, reinforce resources and forecast problem areas and exploit all these factors for competitive advantage.
To put in perspective, this OLAP tool can:
- Represent Outlook fields (including custom fields) as OLAP dimensions, which are naturally interrelated through functional subject areas.
- Provide an OLAP Grid view with support for a multi-dimensional table with expandable nodes. Unique features of control allows for building the OLAP-reports of the exceptional level of complexity.
- Provide an OLAP Chart view that allows representing the data graphically. This gives you a unique opportunity to analyze your business data visually, dealing with charts rather than numbers, which is much easier to perceive.
- Enable you to navigate through these dimensions by drilling down, rolling up, or drilling across – drill down to access the detailed level of data, or roll up to see the summarized data. Roll up through the hierarchy levels of dimensions or to specific characteristics or data elements (columns) of the dimensions. Drill across dimensions to access the data of interrelated dimensions.
- Provide powerful computational functions such as sum, averages, distinct count, maximum, minimum etc. for the measure field (when creating the cube).
- Allow you to save the current state of the statistics in the Grid/Chart working area to a report view file, with specific member fields on the pivot panels (Rows and Column areas) and measure fields in the values area. You can use this report view file in future, to retain back the same state of statistics.
- Support exporting reports to a wide range of formats including Excel, Adobe PDF, XML, bitmaps or web pages.
To get more info about the tool, you can visit – https://www.assistmyteam.com/olap-outlook/
If you have any questions, please leave a comment below.