
Over the decade, businesses and organizations had accumulated a sea of data. However gaining insight from all this information has been challenging for most. Companies need to translate data into information to plan for future business strategies. For example, an online supermarket would be very interested in knowing:
- How do the total sales of all products for 2016 compare with the total sales from 2017?
- How does our profitability of 2017 compare with that of 2015 and 2016?
- What are the spending patterns for customers of different age groups in the last 5 years?
- Has that behavior changed over time?
- How many products were sold per country, state and city this year as opposed to last year?
- For each buyer age group, what is the breakdown of profitability (both margin percentage and total) by product category
- Find top and bottom sales people, distributors, vendors, clients, partners, or customers.
With the traditional online (OLTP) database, major drawbacks with regards to answering, analysis and reporting of the above questions are:
- Reporting, especially, those involving aggregated functions can be slow
- Limited interactivity when performing reporting
- Reporting is well suited to handle textual information mostly
- Complex calculations are often times difficult to implement.
Mining intelligence and insights from business data
Given that the generalization of information using relational query for traditional database, are constrained by a few fields (or dimensions) at a time, it is hard to fully evaluate a complex set of answers without the ability to inspect each dimension in detail, while at the same time, preserving context eliminating all guesswork. This is where Business Intelligence (BI) and Online analytical processing (OLAP) technology comes into relevance.
To put in perspective, OLAP technology can
- Interact with your data and investigate relationships within the data to put information into the hands of the decision makers
- Run complex calculations on the OLAP cube to provide aggregated data
- Easily create your own analytic views.
- Combine your data in any order, at any level of summarization, and over several time periods.
- Enable you to perform Market Basket Analysis. E.g. How many customers who bought product A also bought product B?
The AssistMyTeam OLAP tool is perfectly suited for this purpose – to spot new trends and discover unknown problems in your data flow. It’s simple design allows to quickly create OLAP cube from your database, and then analyze and create reports straightaway.
Creating Cube with OLAP Manager tool
The OLAP Manager tool enables you to connect to a fact table of your database. For this example, we are connecting to the ‘Order Details‘ transaction table of the Northwind Traders sample database, which is related to other tables by foreign key relationships and hence, a perfect candidate to be a fact table. A detailed schema of this database is given below:
From the OLAP Manager, you can connect to a SQL Server (Express edition supported too), Azure SQL (cloud) database or to Access database (*.mdb, *.accdb) and then select a particular table, typically, a fact or transaction table, to show up all the available fields defined for that table (and their related source tables via the foreign key).
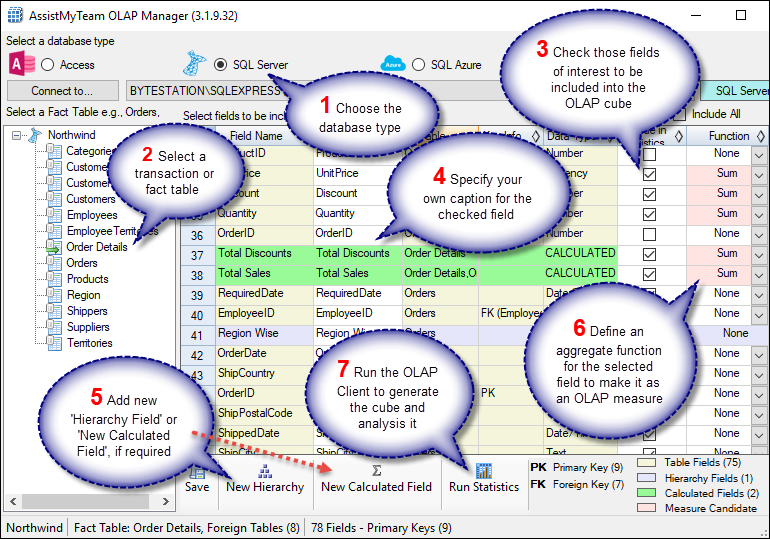
In the OLAP Manager (above), notice that all other fields from related tables (linked through foreign keys) such as Orders, Products, Categories etc. are automatically pulled out, for inclusion into the cube. Once you have chosen which fields or dimensions to include in the statistic, you can select functions for those numeric/currency fields to act as ‘measures’ in the OLAP cube, such that, statistics can be generated across other fields, based on the value of the ‘measure’ fields.
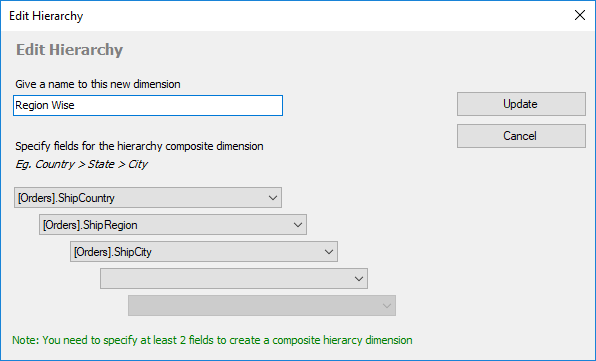
You can add a new hierarchy dimension that supports upto five (5) levels of parent-child members. For example, we have defined a new hierarchy ‘Region Wise’ having the members Ship Country > Ship Region > Ship City, all from belonging to the Orders table.
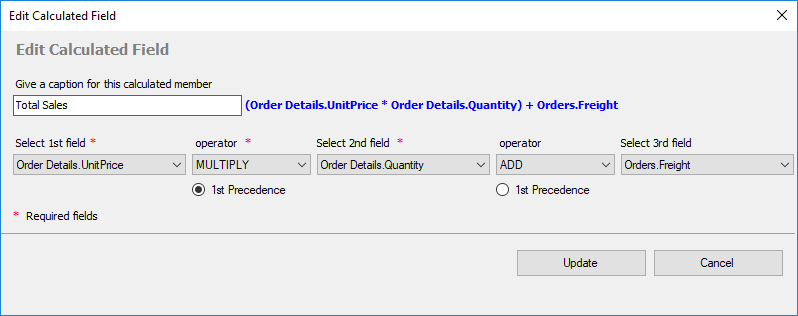
You can also create a new calculated (composite) field derived from mathematical functions between 2 or more member fields. For example, below, we have added a new calculated member ‘Total Sales’ that performs a computational operation involving (Unit Price * Quantity) + Freight.
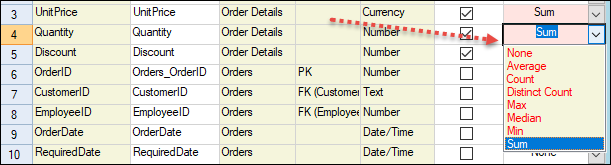
Once you have chosen which fields or dimensions to include in the statistic, you can select aggregate functions such as count, distinct count, sum, average, maximum or minimum for those numeric or currency fields, so as to set them as ‘measures’ in the OLAP cube.
Loading Cube in OLAP Client Tool
Finally, from the OLAP Manager tool, the cube schema is then created and feed to the OLAP Client tool (below) to process and extract the cube from the database. This OLAP Client tool, consists of the Grid and Chart Views. On the left is the Cube structure – measures and hierarchies as a tree. The measures are grouped in the set, displayed in the branch. All the rest of the tree nodes are the dimensions that contain hierarchies. You can then drag dimensions (fields) from the cube structure to the pivot areas (Columns and Rows areas), and then select a measure or two from the cube, and drag it to the values area to generate the statistics.
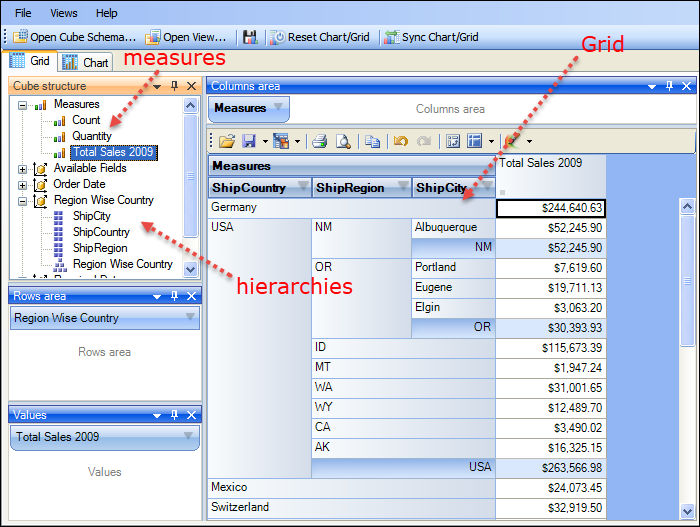
OLAP Grid
The OLAP Client Grid view (above) is comprised of a multi-dimensional table with expandable nodes. These nodes group and display data according to the hierarchies used to define the measures and dimensions upon which the underlying data has been organized. In tandem with the OLAP Chart view, the OLAP Grid view provides an ideal means of clearly conveying data to the user. It is highly navigable and quickly provides detailed information to the user. The speed with which data recall occurs and the strong formatting the grid enforces ensure data is always presentable and easily understandable. Consequently, OLAP Grid views can easily be ported to spreadsheet applications for report compilation purposes.
You can navigate through these dimensions by drilling down, rolling up, or drilling across. You can drill down to access the detailed level of data, or roll up to see the summarized data. You can roll up through the hierarchy levels of dimensions or to specific characteristics or data elements (columns) of the dimensions. You can also drill across dimensions to access the data of interrelated dimensions. In addition, you can set one of these powerful computational functions such as sum, averages, distinct count, maximum, minimum etc. for the measure field.
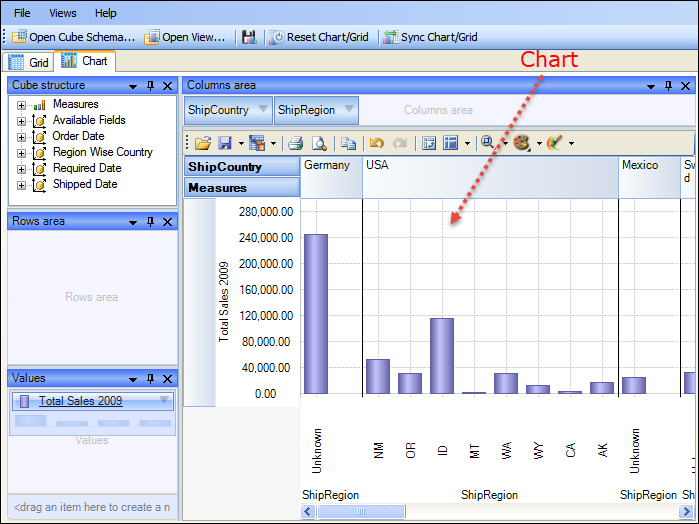
OLAP Chart
While the Grid view (below) allows working with numbers, chart view allows representing your data graphically. This gives you and your team a unique opportunity to analyze data visually, dealing with charts rather than numbers, which is much easier to perceive. Now it’s easier than ever to spot new trends and discover unknown problems in your data flow. The statistical tool will help you gain an insight into your data and make new discoveries.
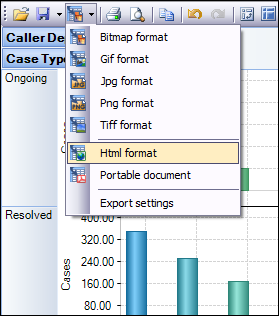
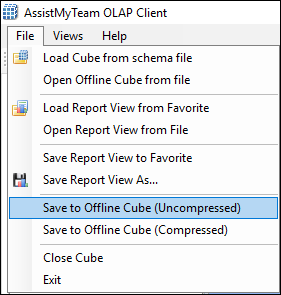
Exporting to file
After a particular snapshot of the statistics is achieved, If you need to share or publish the statistical findings, export it to image, PDF, Excel etc, or print it.
You also have the options to save the pivot settings to file, for accessing the same snapshot in future. If your database is located on a network, you can also save the cube data to file such that you can work offline with the cube, even when the database is not available, or when the network is disconnected.
Summary
AssistMyTeam OLAP tool supports the ability to explore large complex data sets and allows displaying in grids, charts and graphs and support most common operations such as pivoting, drill down/slice and dice, filtering etc. With such arrays of information, you and your management team can re-engineer your business processes, reinforce resources and forecast problem areas and exploit all these factors for competitive advantage. With the capability of complex calculations, trend analysis and sophisticated data modeling, and reporting, OLAP tool helps you to identify critical information on your not so obvious data and extract mission critical information and intelligence that will enable better decision – in your business. Simple and affordable solution, with no requirement of expensive Analysis or OLAP server.
For more info about the tool, you can visit – https://www.assistmyteam.com/olap/
If you have any questions or opinion, please leave a comment below.